The Future of Business Intelligence: From Dashboards to AI Conversations
Remember when business intelligence meant hiring a team of analysts to build dashboards? When "data-driven decision making" required learning SQL or waiting weeks for a report?
That era is ending.
The future of business intelligence isn't better charts or faster queries. It's AI that understands your question, analyzes your data, and tells you what to do—in plain English, in seconds.
The Dashboard Problem
Let's be honest about what dashboards actually deliver:
What We Were Promised
- "Single source of truth"
- "Real-time insights"
- "Data-driven decisions"
- "Self-service analytics"
What We Got
- Dozens of dashboards nobody uses
- Reports that answer yesterday's questions
- Data that requires experts to interpret
- "Self-service" that still needs IT support
The Core Issue
Dashboards are fundamentally passive. They show data. They don't:
- Identify what matters
- Explain why it matters
- Recommend what to do
- Predict what will happen
The human still does all the thinking. And most humans don't have time.
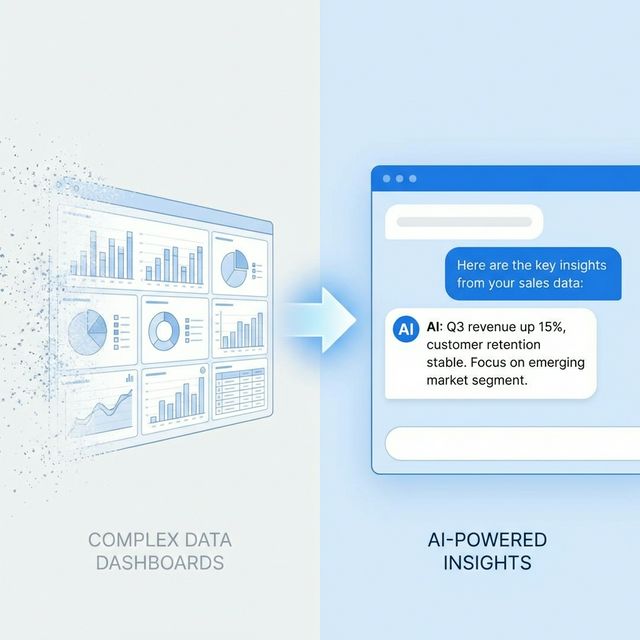
The Conversational Alternative
What if you could just ask:
"Why did revenue drop last week?"
And get:
"Revenue dropped 12% last week primarily due to a 23% decline in Enterprise segment. Investigation shows:
>
1. Two large deals pushed to this week (£180K total)
2. Unusual number of customer renewals landed week prior
3. No change in underlying pipeline health
>
This appears to be timing variance, not a trend. This week's forecast shows 15% above average.
>
No action recommended - monitor for 2 more weeks before concluding."
No dashboard navigation. No data export. No spreadsheet analysis. Just the answer.
How Conversational BI Works
Natural Language Understanding
The AI parses your question to understand:
- What you're asking about (revenue, customers, products)
- What type of answer you need (number, trend, explanation)
- What context is relevant (time period, segment, comparison)
Intelligent Analysis
Based on your question, the AI:
- Queries relevant data sources
- Performs appropriate calculations
- Applies statistical analysis
- Compares to benchmarks and history
- Identifies anomalies and patterns
Response Generation
The AI constructs a response that:
- Answers the specific question
- Provides supporting context
- Highlights key insights
- Recommends actions when appropriate
- Shows confidence level
The Shift in User Experience
Traditional BI Journey
User has question
↓
Opens BI tool
↓
Navigates to dashboard
↓
Finds relevant chart
↓
Adjusts filters
↓
Exports to Excel
↓
Analyzes data
↓
Forms hypothesis
↓
Finds more data
↓
Refines analysis
↓
Makes decision
↓
Time: 2-4 hours
Conversational BI Journey
User has question
↓
Types question
↓
Gets answer
↓
Asks follow-up if needed
↓
Makes decision
↓
Time: 2-4 minutes
What This Means for Different Roles
For Executives
Before: Wait for analysts to prepare reports. Miss details. Make gut decisions. After: Ask questions directly. Get comprehensive answers instantly. Make informed decisions."How are we performing against Q1 targets?"
>
"You're at 78% of Q1 revenue target with 6 weeks remaining. At current run rate, you'll hit 94%. To hit 100%, you need £340K additional closed revenue—equivalent to 2 average enterprise deals or 8 mid-market deals."
For Managers
Before: Build reports for your team. Export data to track performance. Spend hours in spreadsheets. After: Ask for what you need. Share AI-generated insights with team."Who on my team is at risk of missing quota?"
>
"Based on pipeline analysis:
- Sarah: On track (112% coverage)
- James: At risk (67% coverage, needs £45K more pipeline)
- Emily: On track (105% coverage)
>
James's pipeline has been declining for 3 weeks. Recommend pipeline review meeting."
For Analysts
Before: Answer the same questions repeatedly. Build dashboards that don't get used. Maintain complex data infrastructure. After: Focus on strategic analysis. Let AI handle routine queries. Build models for AI to leverage."What patterns are we missing in customer churn?"
>
"Analysis of churned customers over 12 months reveals patterns not in current churn model:
- Login frequency decline: 87% of churners showed 40%+ login reduction 6 weeks before churn (not currently tracked)
- Support ticket sentiment: Negative sentiment in tickets predicted churn with 72% accuracy
- Feature adoption: Customers using fewer than 3 core features churn at 4x rate
>
Recommend adding these signals to early warning dashboard."
For Frontline Workers
Before: No access to BI tools. Depend on managers for data. Make decisions with limited information. After: Ask questions relevant to your role. Get context when you need it."How does this customer compare to others in their segment?"
>
"Acme Corp is in the top 15% of SME segment by revenue. They're below average on product usage (4 features vs. 7 average) but above average on NPS (78 vs. 62). Expansion opportunity: they're not using Analytics module—similar customers see 23% higher retention after adoption."
The Technology Behind It
Large Language Models
LLMs provide natural language understanding and generation:
- Parse complex questions with ambiguity
- Generate human-readable responses
- Handle follow-up questions naturally
- Adapt tone to context
Semantic Understanding
AI understands business concepts, not just keywords:
- "Revenue" connects to multiple data sources
- "How are we doing" means different things by role
- "Compared to last year" handles date math automatically
- Industry terms are understood in context
Multi-Model Architecture
Different AI capabilities combine:
| Component | Technology | Role |
|-----------|------------|------|
| Query Understanding | LLM | Parse natural language |
| Data Retrieval | RAG/SQL | Get relevant data |
| Analysis | Statistical ML | Perform calculations |
| Pattern Detection | ML | Find anomalies |
| Response Generation | LLM | Create answer |
Security and Governance
Conversational BI respects access controls:
- Users only see data they're authorized for
- Queries are logged for audit
- Sensitive data is masked appropriately
- Role-based response depth
Challenges and Limitations
Accuracy
AI can make mistakes. Mitigations:
- Show data sources and calculations
- Indicate confidence levels
- Allow drilling into details
- Human verification for critical decisions
Context
AI doesn't know everything about your business. Mitigations:
- Learn from user corrections
- Allow context setting
- Integrate business rules
- Connect to institutional knowledge
Complexity
Some analyses require human judgment. Mitigations:
- Know when to escalate
- Partner with human analysts
- Handle uncertainty transparently
- Distinguish fact from interpretation
Adoption
Users need to trust and use the system. Mitigations:
- Start with common questions
- Build trust with accuracy
- Provide escape to traditional tools
- Measure and communicate value
The Transition Path
Moving from dashboards to conversations isn't overnight:
Phase 1: Augmentation (Months 1-3)
- Add conversational layer to existing BI
- Handle common questions automatically
- Users still have dashboard access
- Measure question types and satisfaction
Phase 2: Optimization (Months 4-6)
- Expand question coverage
- Reduce dashboard usage
- Train AI on business-specific concepts
- Build confidence in AI answers
Phase 3: Transformation (Months 7-12)
- Conversational becomes primary interface
- Dashboards for edge cases only
- Proactive insights emerge
- True "data-driven" culture
The Sentient Suite Approach
Force AI brings conversational BI to every business function:
Unified Data Access
All five Sentient Suite apps share data:
- CRM: Customer and revenue data
- Finance: Financial and cash flow data
- Supply Chain: Operations and inventory data
- Project Management: Resource and project data
- AI Board: Synthesized strategic view
16-Executive Model
Different questions route to appropriate experts:
- Financial questions → CFO agent
- Market questions → CMO agent
- Operations questions → COO agent
- Strategic questions → CEO synthesis
Always Available
Unlike traditional BI (need a computer, find the dashboard, apply filters), conversational BI is:
- Available in the app, Slack, email
- No training required
- Accessible to anyone with access rights
- Answers in seconds, not hours
Measuring the Shift
How do you know conversational BI is working?
| Metric | Traditional BI | Conversational BI |
|--------|---------------|-------------------|
| Time to insight | Hours-days | Seconds-minutes |
| Users with regular access | 10-20% | 80-90% |
| Questions per user/month | 2-5 | 20-50 |
| Decision confidence | Variable | Higher (more context) |
| Analyst time on ad-hoc | 60%+ | < 20% |
What Stays the Same
Conversational BI doesn't eliminate:
- Need for data quality: Garbage in, garbage out still applies
- Need for data strategy: Knowing what to measure matters
- Need for human judgment: AI advises, humans decide
- Need for analysts: Role shifts to strategy, not elimination
What Changes
Conversational BI does transform:
- Accessibility: Everyone can query data
- Speed: Answers in seconds, not days
- Depth: AI can analyze more than humans can manually
- Consistency: Same questions get same rigor
- Proactivity: AI can surface insights without prompting
Getting Started
Ready to move beyond dashboards?
- Try Force AI at executiveforceai.com
- Connect your data sources (or start with sample data)
- Ask questions in natural language
- Experience the difference between dashboards and conversations
The future of BI is here. It speaks your language.
Force AI is available in all Sentient Suite tiers. Start your free trial →